Tag: reports

  • A Million Voices: VoC Survey Results Analysis

    A Million Voices: VoC Survey Results Analysis

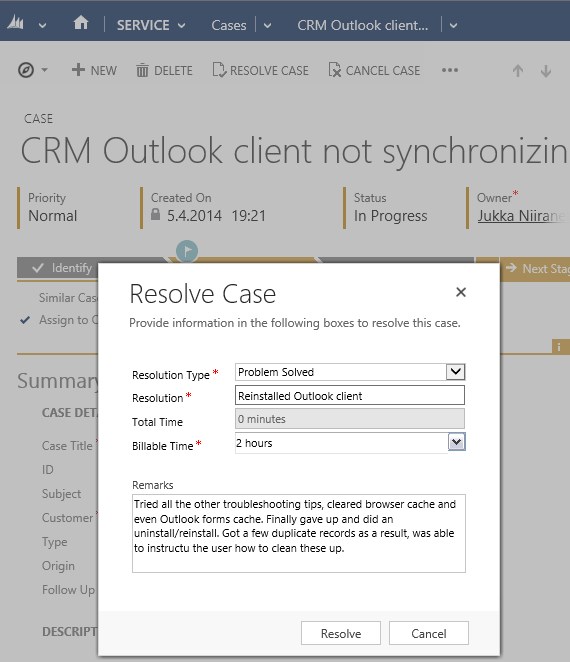
    A few weeks ago I launched a demo survey built on Voice of the Customer, the brand new survey tool from Microsoft. The goals I had for this exercise were twofold: 1) see how these type of interactive tools could be used in live events like eXtremeCRM 2016 Warsaw, and 2) gain some experience on what it is actually like to work with incoming survey response data inside Dynamics CRM. In this post I’ll mainly be focusing on the latter one, although the example data we’ll be looking at are the live answers you & other readers of this blog submitted via the eXtreme MVP Survey.

    VoC_survey_page

    As you may know, Voice of the Customer (or VoC as we’ll refer to it from now on) is a pure XRM solution. Although the actual customer facing survey forms are of course not presented via the Dynamics CRM client UI, everything that you use for configuring the survey questions and logic, as well as the incoming survey responses, is managed with CRM entities and stored into the CRM database. The reason this is such a big deal is that most of you will already possess the skills needed for leveraging such data via views, charts and dashboards as it’s just XRM all the way. Furthermore, you’re free to design business processes around the survey functionality with tools like real-time workflows or business rules. Naturally you’re also able to interact with the survey entities and records via the latest CRM Web API, should you come across some integration scenarios where data needs to either flow in or out to another system.

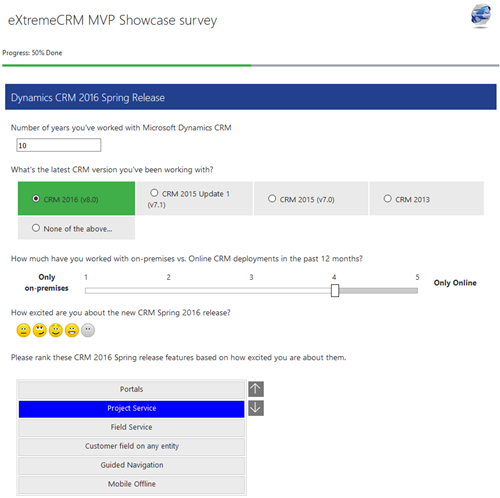
    The flip side of this coin is that VoC is unfortunately very XRM-ish to work with. If you compared it to dedicated survey apps that do nothing but questionnaire design (like SurveyMonkey, Surveypal and the likes), survey publishing and response data analysis, then there’s still quite a big gap for Microsoft to work on bridging when it comes to the end user experience of this tool. In a way this is quite understandable since the value proposition of VoC really is all about the tight integration with your customer data and the ability to send survey invitations automatically as a part of your customer facing processes; such as a survey link being emailed to a customer after a support case is closed in CRM, to gather quick ratings and design automatic escalation paths if the KPI’s are not met. Nevertheless, since VoC does also support creating pretty advanced surveys for collecting quantitative data from a broad target group in more traditional campaign style satisfaction surveys, as well as anonymous survey links presented on website, it’s good to understand what it’s like analyzing such data inside Dynamics CRM.

    VoC_Survey_Summary_report

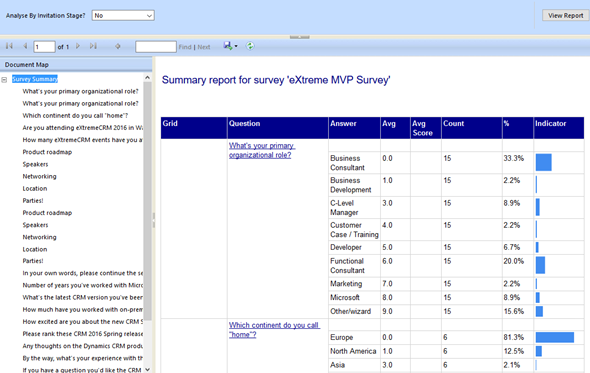
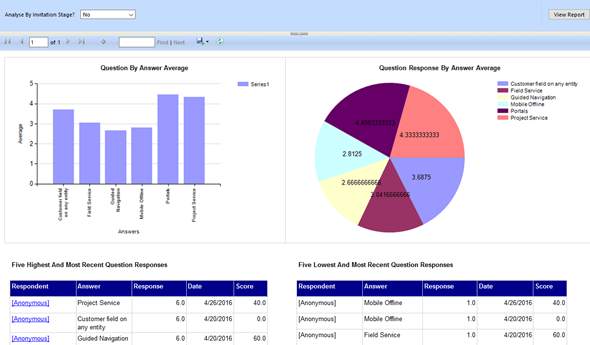
    There are a lot of components in the VoC solution right out of the box. First off, there are four SSRS reports: Survey Summary, Question Summary, Net Promoter Score and Survey Export. The first two are general purpose reports with tables and charts summarizing the data either across a single survey or a specific question, as illustrated in the screenshots shown here. The NPS report is naturally aimed for this particular survey type, whereas the export one is a single huge matrix for dumping out the raw survey response data into Excel for further manipulation.

    VoC_Question_Summary_report

    For more interactive data analysis there are eight dashboards in the VoC solution. However, these may not be all that useful for many real life scenarios, since they suffer from the same limitation as all Dynamics CRM dashboards: there are no global filters you can apply for all the dashboard components. Meaning, unlike with an SSRS report launched from CRM, you can’t set the context of the dashboard to be a specific survey. Yes, with the new “interactive experience dashboards” introduced in CRM 2016 you do get this type of filters, but since right now those features are limited to the Interactive Service Hub only (which in turn has a fair number of limitations for general use), it’s not exactly the kind of solution we’d need right here.

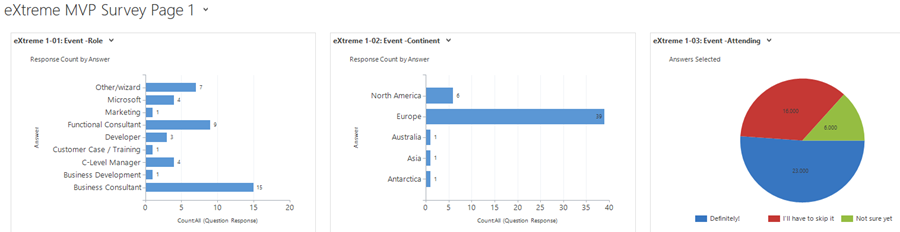
    That doesn’t mean we couldn’t build pretty dashboards to summarize our survey responses, though. I had a go at this with the eXtreme MVP Survey and it turned out pretty well. Have a look (click for a larger image):

    VoC_eXtremeMVP_dashboard_page_1_small

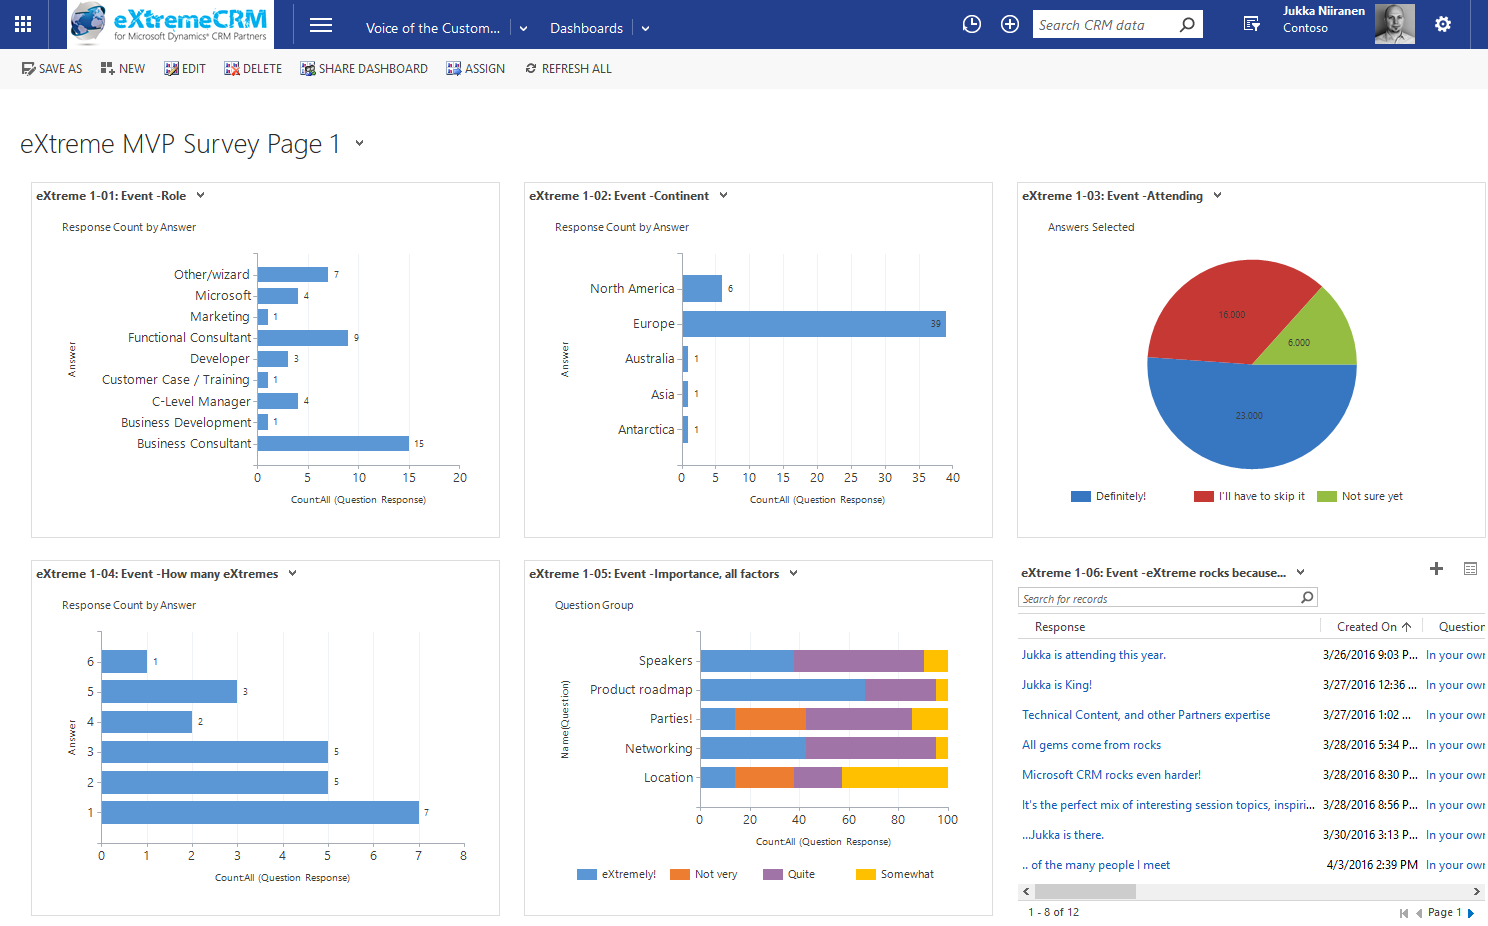
    In the survey form I had three pages full of questions and I constructed the corresponding pages as personal CRM dashboards. This allowed me to both monitor the incoming responses during the survey data collection period as well as present the results to the audience at the MVP Showcase session in eXtremeCRM. It looks good, it appears very familiar to existing CRM users and it gets the job done without having to resort to any complex report development. (more…)

  • Previewing the New Power BI Experience with Dynamics CRM

    Previewing the New Power BI Experience with Dynamics CRM

    Around one year ago Microsoft introduced the capability to access CRM Online data via Power Query, one of the client side components of the Power BI suite. More precisely, the capability to authenticate with the already existing CRM OData feeds via Office 365 credentials was introduced into PQ, which then allowed us to use CRM Online as one data source in our Power Pivot data models driving Power View visualizations. No Dynamics CRM specific feature had really been developed, but it was the first step on the road of unlocking the cloud data from the analysis limitations that the previous tools (CRM charts & dashboards, SQL Server Reporting Services reports with Fetch XML queries) had imposed on CRM Online customers.

    There was a lot left to be desired still. Building reports from the raw OData feeds can be a cumbersome process, since no built-in tools existed for filtering the amount of data pulled from the entity tables. Also, not all the components needed in basic reports, such as optionset labels, were available to be retrieved dynamically from the OData feed. The biggest gap, however, has been the inability to automatically refresh the reports published onto Power BI portal, which means that each report end users would have needed to perform this refresh manually. As a result, Power BI has so far not been a something that I would have suggested to CRM Online customers as a company wide reporting solution, since it’s mainly been suitable for fairly advanced CRM power users building their own reports via Excel 2013.

    The Next Generation of Power BI

    Just before Christmas Microsoft announced the new Power BI Public Preview, which has a number of impressive looking enhancements to the service offering:

    Include in this announcement was also the statement: “In addition to the existing seamless connection with Microsoft Dynamics CRM Online, with today’s release customers can also connect to their data in Salesforce, Zendesk, Marketo, SendGrid, and GitHub with many more to come in the months ahead.” Upon first read, it was easy to interpret it as “nothing new for you Dynamics CRM folks out there right now, better luck in the next update!” This, however, isn’t the case.

    PowerBI_Preview_CRM_app

    When browsing through the new support site for Power BI I came across a posted idea on supporting Dynamics CRM as a data source, and a very recent comment from a Power BI product manager that the new Public Preview actually included native support for Dynamics CRM. Here’s the article where you can find the exact steps needed for connecting your Power BI Preview instance to Dynamics CRM. As this Preview is only available in the US for now, I decided to spin up a new CRM Online trial org from across the pond and try it out.

    What’s in Store for Dynamics CRM Cloud BI?

    After going through the process of enrolling for the Power BI Public Preview program with my Office 365 US trial tenant, I completed the steps for connecting to CRM Online. This really is quite a simple process with not too many options. You only have to dig up the OData feed URL from your CRM Online instance. After you’ve added this Microsoft Dynamics CRM app into your Power BI environment, the data retrieval process will start uploading your CRM Online records from one cloud to another. (more…)

  • Access Option Set Labels in Dynamics CRM OData Feeds via Power Query

    Access Option Set Labels in Dynamics CRM OData Feeds via Power Query

    If you’re using Dynamics CRM Online without direct access to the underlying SQL Server database, there may have been a few occasions when you’ve wished for more flexible options for reporting and customer data analytics than what is possible via configuring CRM charts or developing Fetch XML based reports in Visual Studio. Late last year Microsoft enabled support for accessing the secured OData feeds from CRM Online via the Excel Power Query tool, which opened up some interesting options for building modern BI solutions on top of the CRM data up in the Microsoft cloud.

    CRM_OData_Excel

    For a non-developer who hasn’t leveraged OData before it might come as a bit of a surprise that not all of the business data is necessarily readily available via the feeds when examining a particular CRM entity. One crucial thing that’s missing is the option set values. More specifically, it’s the label values that are not accessible via the entity tables retrieved via the OData feed, as all we have access to are the numerical values representing the labels (1, 2, 3, 4… 10001), but not the human readable versions.

    CRM_OptionSet_Value_Label

    From a reporting perspective, it’s very likely that any chart or table that you wish to build is going to leverage one or more option set fields. Formerly known as picklists, these are basically the dropdown fields on CRM entity forms that allow the user to select one value from a list of predefined values. Much more convenient for reporting purposes than free text fields, as I’m sure you’d agree.

    So, what are our options then? We could of course manually create new tables into the Excel workbook that store the mapping of ID values and labels, but that just doesn’t sound like a fun exercise at all. More importantly, that would only give us a static list of option set values that couldn’t adapt to the changes in CRM customizations. Nope, not a good approach from report maintenance perspective, so let’s not go there.

    As a bit more efficient workaround we could be adventurous and import a copy of the CRM solution file containing the entity customizations as an XML data source into Power Query and then pick out the necessary mappings from there. Due to the power of Power Query, this would actually technically work, and we could even set it to reference a file location from where the latest customizations would dynamically be imported upon workbook refresh. Still, that would leave us the burden of setting up an automated export system that would produce the customizations.xml file to reflect the latest changes.

    After a bit of poking around in the OData feed data source, it turns out the optionset labels are actually included there. The tricky part is that they’re not simply a [Record] link that you can drill into and expose the values from your existing entity data set. Nope, they reside in a specific table of their own, called PicklistMappingSet. In this tutorial I’ll show you how to retrieve the data for a “Leads by Source” chart created with Power View, taken from an OData feed data source pointing to Dynamics CRM Online, using Power Query to pull the data into a data model built with Power Pivot.

    1. The Data Source: Power Query

    PowerBI_CRM_Odata_1To follow the steps you should have the latest Power Query version installed in your Excel client. I’ve already covered how to access CRM OData feeds from Power Query in a previous article, so please refer to that one if you haven’t done the exercise before. After connecting to the OData feed URL we should select the tables that we want to work with from the data source navigator pane. By minimum you should grab the LeadSet and PicklistMappingSet to build the chart.

    The problem with CRM and OData is that by default the feed will pull down each and every record in the table. The query performance is less than stellar with CRM Online and if you have a high number of leads (status doesn’t matter, also the closed ones will get downloaded), you might be waiting for a while before the query is completed. If you want to move on a bit faster then check out this great tip by Andre Margono on how to set up a query filter for the Dynamics CRM OData query (for example, only active leads).

    The real beauty of Power Query is in the query steps you can use for manipulating the workbook queries. Before we go there, though, let’s create a duplicate of the PicklistMappingSet query. This will make it easier for us to map the values into our actual leads table later on, as well as preserve the original option set value table available for further queries.

    PowerBI_CRM_Odata_2

    Open up the new duplicate query you’ve added into the edit mode by double clicking on it, which launches the Power Query query editor (yes, query is the word of the day). The first step we’re going to add for the query involves expanding a column that only shows a green “Record” value by drilling into it from the small icon next to the column label. Do this to the ColumnMappingId column and just load up all the columns found from behind it.

    PowerBI_CRM_Odata_3

    You’ll see the Record column transformed into three new columns as a result of drilling down into the data. The column we’re interested in is ColumnMappingId.Name, which has the names for all option set fields in our source CRM system. For this example we want to see the LeadSource field, so add a new filter for this value, just as you would in a normal Excel data table.

    PowerBI_CRM_Odata_4

    By now you might have noticed that the Applied Steps box in the Query Settings pane is collecting all of the actions that we’re performing on the query and storing them as steps. If you make an error in your selection, just click the delete symbol next to the steps to get rid of it. (more…)

  • Accessing “Special” Activity Data with CRM Report Wizard

    Sometimes a data model that is perfectly valid on a logical level does not enable the system end users to actually leverage the data stored in it. One example of such a design is the way Microsoft Dynamics CRM handles the information collected on the standard (uncustomizable) dialog windows used in the case resolution and opportunity close processes. While the information collected here would often be valuable for managing the business process and analyzing the results (“what information was provided to the customer while closing the case?” or “why did exactly we end up losing this opportunity?”), it cannot be easily accessed in a way that would show data from more than a single record at a time.

    CRM_Case_Resolution_Dialog

    This is due to the fact that the case resolution and opportunity close information is not recorded onto the actual business entity itself but rather onto a related activity. There are specific activity types for both of these processes that get created once a user clicks OK on the respective dialog for setting the business record status as closed. This makes sense if we think about the lifecycle of a record like case or opportunity, since the closure is not necessarily a permanent end state. The user can reactivate a case or reopen an opportunity and continue working on it if the circumstances and the business process guidelines dictate this to be the correct route of action, in which case there will eventually be more than one close activity for the business record. The data model therefore needs to support a 1:N relationship between these entities, which is why the design of the out-of-the-box business processes in Dynamics CRM is justified.

    The unfortunate side effect of this design is that the system cannot easily produce views of closed cases with both the question and answer information, as these are stored on separate entities. It is equally difficult to view and analyze information regarding won or lost opportunities, as any comments entered by the opportunity owner during the closure event are not available on the opportunity record itself. What makes the situation even more unfortunate is that the Advanced Find UI does not surface these “special” activity types and make them available for custom views, so even extracting the data from the system for ad-hoc analysis in Excel sheets is not directly possible.

    One approach that I often recommend to customers is to develop additional business logic that will store the information about the latest case resolution or opportunity close onto custom fields on the case/opportunity entity. I’ve also written a blog article earlier about how ISV tools like North52 Business Process Activities (formerly known as Formula Manager) can be used for building a no-code customization to better leverage case resolution data. This of course will not cover any records created prior to deploying the customization, so accessing historical information is still a challenge.

    Reporting on Case Resolution Data

    As always, by developing a custom SQL Server Reporting Services report you could access almost any data in CRM and present it exactly the way you want. You’ll need to use Visual Studio and know a thing or two about how to develop SSRS reports for CRM if you take this approach. In the standard user interface of Dynamics CRM there is only the Report Wizard feature available, which in many cases offers quite limited options for designing reports that would go beyond what the inline charts in CRM views can do. This Wizard was originally introduced back in CRM 4.0 when there was no charting or dashboard capability included in Dynamics CRM yet. Once CRM 2011 brought in these new visualization options, the Report Wizard was pretty much abandoned in terms of new functionality development, so today it remains sitting there in its 2007 outfit and looking a bit outdated as a result.

    One of the lesser known qualities of the Report Wizard is that you can actually access certain entities and fields with it that are off limits to Advanced Find. This comes in quite handy when dealing with a scenario like the one I described earlier. So, let me show you how to build a Report Wizard report that will provide you better access to case resolution data.

    When creating a new report and choosing Report Wizard as the type, you’ll first be taken into a dialog window where you can choose 2 entities that you’re allowed to use in the report. By selecting Activities as the primary record type we’re presented with a list of possible related record types that includes also the “hidden” entities like Opportunity Close or Case Resolution. For our purposes, let’s select the resolutions.

    CRM_Report_Wizard_1

    Now we get to the filter criteria screen. Let’s say that we want to build a report on the billable time information recorded into the case resolution entity. We’ll only be interested in resolved cases and case resolutions that contain data in the Time Spent field (this is where the billable time field data in the case resolution dialog gets stored in). (more…)

  • Working with Price List Items in Dynamics CRM

    Working with Price List Items in Dynamics CRM

    Despite of the recently refreshed user interface of Dynamics CRM 2013 that offers a much more fluid user experience than previous versions, there are still areas in the application that are not very user friendly. Many of these revolve around product and price information, regarding how it is presented and what actions are allowed on it. In this blog post I will drill into a common scenario that organizations who use CRM for managing price list data may run into and present a few options on how to make their lives easier.

    Price List and Price List Item Views

    A pet peeve of mine in Dynamics CRM has always been the UI that the Price List entity offers to the end user. As many of the readers of this blog will surely know, price list items are the way how products, units, price lists and the all important price figures come together in the CRM data model. If you want to leverage the product catalog and any price calculation features in the sales module, you’ll need to work with price list items and create at least one of them per each product you plan to include as line items on your opportunities, quotes, orders and invoices.

    Unless you’ve built a custom integration to a back-end system that will automatically provide the latest pricing information for CRM, there’s quite a bit of work involved in maintaining individual price list item records when prices change or new products or lists are introduced as a normal part of the day to day business. When a CRM user opens a price list record, a reasonable assumption to make would be that he or she is interested in reviewing the pricing information given to the included products. Unfortunately the Dynamics CRM UI does not make such an assumption, rather it thinks the user is interested in only viewing a list of products and their units but not the actual price information in the amount field. Here’s what the default associated view of the price list items gives us:

    Price_List_Item_CRM_2

    Well, that sure looks like a good candidate for some entity customization work. Yes, it does, but there’s a “but”. When you open the customization UI and navigate to the price list item entity, you discover that the views are actually not customizable. Nor can you add any of your own views for that matter, which means you’re stuck with the default UI. If you think that the price list item entity should allow view customization, then there’s a suggestion on Microsoft Connect that you definitely should go and vote for (if you need help in registering to Connect itself, see this post).

    Exporting the Price List Item Data to Excel

    With this limitation in mind, what are our options of producing a true price list view with product and price information shown side by side? For any Dynamics CRM power user the first thing to come to mind will surely be to export the data into Excel. Unfortunately the uncustomizability of the Price List Item entity also means it has been blocked from showing up in Advanced Find, which would normally be our tool of choice for preparing a CRM data export.

    Luckily there’s still an Export to Excel button visible in the ribbon of the price list form when we are viewing the associated price list items view. Clicking this will present us with an option to either export the data in static format (which would just give us the same columns as the current view) or to create a dynamic Excel sheet in two possible formats. Both of the latter options, pivot table and worksheet, present a follow-up dialog where choosing the required columns from the price list item entity and even any parental entity like product is possible.

    Price_List_Item_CRM_3

    When you export the view into a dynamic Excel sheet in an on-premises CRM environment, you can actually go and look at the SQL query that the view is using for pulling the data from CRM to Excel. Just click “Change Data Source – Connection Properties – Definition” and copy the query from the Command Text window into Notepad. With a little tweak that removes the reference to the currently viewed price list record we can use the same dynamic Excel sheet to retrieve price list item data for all the price lists in the system.

    Price_List_Item_CRM_1_small

    In the SQL query you’ve copied to Notepad you’ll find a reference to the price list from under which we exported the related price list items. It will look something like this: where  (“productpricelevel0”.pricelevelid = N’CEA84006-AD7B-E311-9405-00155D6214FA’) . Just remove this whole where clause, thus expanding the query to retrieve all records from the price list items table in CRM, regardless of the associated price list. Then with the Excel pivot table tools you can group and filter the data any way you please, effectively creating a price list report that views the latest information from CRM in a layout that best suits our purposes. (more…)

  • Dynamics CRM OData Feeds and Power Query: What’s the [Record]?

    Dynamics CRM OData Feeds and Power Query: What’s the [Record]?

    Now that Power BI has hit the GA milestone (general availability), I decided to spin up a trial subscription for it and get familiar with the tools that it offers. My previous experiment with connecting to CRM Online OData feed with Excel 2013 Power Query seemed to be one of the very few blog posts that come up when you search for information on the topic. In that article I never bothered to go deeper into actually working with the CRM data as the big news really was that the latest version of Power Query was finally able to access data from CRM Online, thanks to the added support for Office 365 authentication on the OData feed.

    I repeated the steps for connecting my Excel 2013 Power Query to a CRM 2013 organization hosted on CRM Online and started to think about a simple report I could build. Opportunities tend to be a nice entity for demonstrating your typical reporting needs on summing money values based on sales process stage, owner etc. so I selected the OpportunitySet to be included in my workbook query. Scanning through the columns showed that I had every field I needed, but there was one problem: I couldn’t see the actual data in them. Instead of the Estimated Revenue figures or Owner names all I had was a link that read “Record”.

    Dynamics_CRM_Odata_Reporting_1_small

    “Hmm, well, a link’s a link so let’s click on it then. (Click) Okay, so now I’ve drilled down into an individual value. I no longer have a grid of opportunity records and columns, which kinda sucks. Oh, and also I can’t see any Undo button to take me back.”

    Life would be so much easier if you just read the manual before starting to use new tools, but ain’t nobody got time for that in the fast paced IT consulting world, right? After a bit of trial and error I figured out what the procedure for turning that [Record] link into actual data values is. Since it’s not immediately obvious, I decided to write it down onto this blog post, so that anyone else experimenting with using Power Query and Dynamics CRM Odata feeds can move on faster than I did.

    In all the columns that display the record link you can see a small icon with two parting arrows on the right side of the column header. This is where you can drill down to the column contents and choose which attributes for that field you would like to include in your query data. For example, when I click on the CustomerId column on the OpportunitySet query, the following menu opens up:

    Dynamics_CRM_Odata_Reporting_2_small

    Once you click OK, the values for the chosen columns to expand will be shown on the query editor grid. Repeat this for each column you plan to leverage on your report. As you expand more columns, you’ll notice that the Applied Steps dialog in the query settings pane will list each of them as a step. You can also see that these fields will be included on the formula bar, which will read something like Table.ExpandRecordColumn and then a list of our chosen attributes.

    Dynamics_CRM_Odata_Reporting_4_small

    After we’ve expanded all the necessary columns, we can then proceed with using this data in our report. While Power Query is the component in Excel 2013 that pulls the data into our Data Model, it doesn’t necessarily offer all the tools that we’d want to use for working with the data set. Move over to Power Pivot instead to define relationships between different tables, rename the columns, create calculated columns and do any other manipulation with the data before presenting it on a report layout. Then finalize your work on the Power View canvas and design the report that you wanted.

    Dynamics_CRM_Odata_Reporting_5_small

    There’s an excellent tutorial available on the U2U Blog that covers all of the steps in more detail: Dynamics CRM 2013 and Power BI for Office 365 – Part 1 and Part 2. Wish I had also found that earlier on, but better late than never…

    There should also be a Part 3 coming up that will talk about how to upload the report onto Office 365 Power BI for publishing it to the end users. I’m quite interested in seeing what will be the procedure here, because I’ve not seen much information about how to consume OData feeds in the Power BI portal. In fact, this tweet by Jamie Thomson implies that some OData features would have been dropped from the product:

    PowerBI_OData_suppor

    When I click around in the Power BI Admin Center, I don’t see any options for adding a new data source that would be an OData feed. If I’d like my report contents to get updated after I’ve uploaded it, I’d need to set up the Scheduled Data Refresh feature. However, the list of supported data sources doesn’t mention anything about Dynamics CRM. This leads me to believe that the current version of Power BI doesn’t yet support using CRM OData feeds as data sources in reports published on the Power BI portal.

    With an on-premises Dynamics CRM instance you could of course set up a direct SQL Server data source and publish it to Power BI via the Data Management Gateway component. However, the much more interesting cloud scenario of building Power View reports that leverage data from CRM Online directly seems to be beyond the current feature set offered by Power BI, unless I’m mistaken. Let’s hope that we get more information about the possibilities of Power BI for CRM Online customers when Microsoft presents their latest Dynamics product roadmaps at Convergence 2014 in a few weeks time.

  • Connecting to CRM Online OData feed with Excel 2013 Power Query

    The latest version of Excel contains a Get External Data menu option for linking the workbook to an OData data feed. Knowing that Dynamics CRM 2011 and 2013 both provide an OData endpoint, this would seem like a great option for retrieving data from a CRM Online based system for reporting purposes, since direct database connections aren’t available in the cloud. Unfortunately, if you try to enter the CRM Online OData URL as a feed link, you’ll get this error message:

    CRM_OData_feed_Excel_error

    “We can’t use the data from this feed.” Bummer. The reason behind the error messages is that Excel and PowerPivot have not been able to support the authentication mechanism required for accessing the CRM Online OData feed. There is a workaround that you could apply if you’ve got the CRM Outlook client installed on the same machine, as described in this video by Ed Martinez, but in general using PowerPivot for CRM Online reporting has been quite restricted.

    Power BI December 2013 Update

    Last summer Microsoft announced the preview program for Power BI, their cloud based business intelligence suite, containing tools for publishing reports in Office 365. The Power BI umbrella also covers client side components, including Power Pivot (now spelled as two separate words apparently) and Power Query, that bring new capabilities to Excel. To get an understanding of the features included or under development, I encourage you to watch this Power BI demo from WPC 2013, which definitely deserves the Coolest Tech Demo of 2013 trophy if you ask me.

    PowerBI

    The latest December 2013 Update for Power BI announcement mentions the following enhancements:

    “Power Query can now connect to more data sources:

    • Sybase IQ
    • Exchange
    • Dynamics CRM Online

    Hey, that last part sounds great! So, what does it mean in practice for us CRM people? Well, the Power BI Preview subscription still doesn’t provide the option to provision a CRM Online instance for the same Office 365 instance, so there’s not that much new things visible on the cloud side yet if you spin up a preview org. On the client side, however, there is now an updated version of Power Query Preview for Excel 2013 that gives us the possibility to finally connect to a CRM Online OData feed directly. Let’s explore that in more detail. (more…)

  • Dynamics CRM Data Visualization with Excel 2013 GeoFlow

    Excel_2013There are some great new features available in Excel 2013 that can take your Dynamics CRM data visualization onto a whole new level without the need to invest in new server infrastructure or build traditional OLAP cubes on your SQL Server. With the recent announcement of the GeoFlow Preview for Excel 2013, I decided to see what I could make of this tool when combined with some data pulled from CRM.

    Working with Cloud Data

    Although the feature parity of CRM Online and Dynamics CRM on-premises is on quite a high level these days in terms of the application platform capabilities, one unfortunate limitation has been that you can’t easily tap into the CRM Online data with analytical applications like Excel PowerPivot. Naturally the direct SQL database table connection is unavailable, but also the OData feeds that would be such a neat way for performing some pivot magic have been off limits, as PowerPivot doesn’t support the claims based authentication of CRM Online. Oh, and as far as I know, this also applies to an IFD configured on-premises server  (if anyone knows how to connect to the OData feed with AD authentication while using an IFD CRM, do leave a comment below).

    With the new capabilities of Excel 2013, there is now a workaround available that allows you to access OData feeds from CRM that require Windows Live ID / Microsoft Account / Office 365 authentication. You’ll also need the CRM Outlook client on your workstation to facilitate the initial connection, although with another workaround for the sign-in prompt on the Excel sheet you might be able to do without one.

    Here’s a great video from former Dynamics CRM Team member Ed Martinez that walks you through the steps needed in order to connect your Excel 2013 (note: Excel 2010 is not supported AFAIK) to a Dynamics CRM Online OData feed:

    (For all the Finnish speaking CRM folks out there, you can also check out this video clip by Sulava’s Markku Suominen.)

    As a summary, what you need to do is:

    • Copy the OData feed address from the developer resources menu of your CRM
    • Export any set of data from CRM to a dynamic Excel sheet
    • Open the file and refresh the data (thus establishing the authenticated connection), the save it in .xlsx format
    • Add a new data source by clicking on “Get External Data, From OData Data Feed”
    • Paste in the address you previously copied from CRM

    That’s it. Now you can connect an Excel sheet to a CRM Online (or IFD) data source through OData and refresh the content to reflect the live data as your CRM source system gets updated.

    Power View in Action

    For my own lil’ “Big Data” scenario I decided to point my OData enabled Excel 2013 towards a Dynamics CRM instance where ClickDimensions is storing the website visitor data from this blog (sorry, you’re being tracked, but it’s all for a noble cause, trust me). I proceeded by following the instructions above, adding a new OData data source into a dynamic Excel sheet, selecting the entities (“sets”) that I wanted to use in my analysis. Then I waited… and waited… and waited some more.

    OData_data_feed_connection_wizard_CRM

    A word of warning: OData data feeds can be slow. It’s nothing like using a direct database connection, and not even the type of performance you get with a dynamic Excel in an IFD environment that uses an Excel Web Query to “screen scrape” the data over http. My data set was retrieving around 100,000 records and I saw the counter ticking on the bottom right corner of the Excel sheet at a rate of roughly 200 rows per second, which translates into some 10 minutes of waiting before the download from CRM is complete. Oh well, it’s not like we’re in a rush to create a real life report for the boss who wants to have it in his inbox within 15 minutes. Let’s be grateful that we can at least retrieve more rows in one go than the default MaxRecordsForExportToExcel setting for this CRM organization would otherwise allow (which is 10,000). (more…)

  • Creating recurring goals with some workflow magic

    Goal management is one of those features in Microsoft Dynamics CRM 2011 that has a relatively high barrier for utilization. The initial thought of measuring the business results of your organization through a built-in mechanism in your CRM system resonates with almost any customer that you tell about goal management, yet the excitement tends to wear out quickly once they discover the effort required in configuring and maintaining the goals. Sure, if you’ve only got a small organization and set goals on annual or quarterly level, it’s not such a big burden to key in the goal records with metrics and targets. But what if you’d like to measure something on a more real-time basis, like monthly or weekly? Even daily? Not such a fun thought anymore, now is it?

    There are creative workarounds available for generating goals for a larger number of data points. The most practical tip I’ve come across has involved copying goal records by creating a dialog process to streamline the steps required for reproducing existing goals. I originally read about it from a presentation by Richard Knudson on Scalable Goal Management in Dynamics CRM 2011. You can view the slides from eXtreme CRM 2011 Las Vegas in PowerPoint Online or alternatively read this blog post by PowerObjects that walks you through the dialog creation process.

    A different way to define goal time periods

    Sometimes what you need in terms of process measurement isn’t down to the detailed level of setting individual target values for each week or each user. Maybe you have a steady weekly target of X records in a particular state and you’d just want to easily see how you’re currently performing against this target. Here’s were a more recent article by Richard comes in handy: Goal Criteria and Dynamic Goals. The big message here is that you’re not actually forced to use the From and To dates of a goal record to determine the measurement period. You can basically set a goal to be running for 20 years and instead limit the number of records evaluated by the goals Rollup Query through a dynamic date criteria like “last 7 days”.

    Whit this little trick, setting up a dashboard that shows the current performance is super easy, no matter how short your goal time period is. The charts will update once per day based on the default roll-up recurrence  frequency, so displaying the difference between the target and the actual value for metrics like leads qualified or calls made requires you to only set up the goal once per each variant (owner, status, type…) but not the different dates. Just stretch the goal period to be as long as you like and control the dates in the Rollup Query definition.

    The downside of this approach is that the goal measurement is completely dynamic, meaning past values will leave no trace. Sure, you could enable audit on the goal entity to keep some form of results history, but since the audit data is not available for views, charts or even custom SQL reports (without some hacking), it’s not quite as easy as with the traditional method of creating goals for each time period separately.

    Tracking historical results without manually creating goals

    Another recent Dynamics CRM blog post favorite of mine comes from Yaniv Arditi. In his three part series (part 1, part 2 and part 3) Yaniv presents a model of how to implement an asynchronous batch process in Microsoft Dynamics CRM. Best of all, in his final post he provides a solution file that you can download and apply in your CRM organization.

    What does the solution do then? Basically it is a way to implement a much needed but currently missing feature of Dynamics CRM: easily scheduling recurring workflows on a group of records. With this solution you can specify a batch process that runs every X days, performs a query of the required CRM records and then initiates a workflow process for each of those records found. You schedule it once, leave it running and the related process will always create a new waiting instance of itself once it stars at the defined intervals.

    What’s the Fetch XML in there? It’s the Target Records Definition that determines for which records the workflow process selected in the Action Workflow lookup field will be executed. Where do you get the Fetch XML then? That’s easy: from any Advanced Find view, just by clicking the “Download Fetch XML” button on the ribbon.

    To put this solution into work together with the concept of dynamic goals, I’ve got the following sample use case: track the number of active cases on a daily basis and compare it with a target value. This is an example of a status metric that’s not so simple to directly calculate from the records in CRM. To produce a figure like helpdesk queue length you would need to not only retrieve the number of cases created on any given day but also compare it with the closure dates of cases. It would be much easier if we could just take a snapshot of the currently open records on a set interval and store the information into CRM. So, why don’t we do just that?

    First, let’s set up a custom entity called “Snapshot” to hold the data for us. We’ll establish relationships to both Goal and Goal Metric, then add the necessary fields for holding the types of data we want to track, in this case integer values for target and actual.

    Next we need an on-demand workflow process that will create these Snapshot records for us from the goal data.

    The batch process record shown previously has already been configured to perform the task we want: based on a daily schedule, retrieve all the goal records for which we want to be tracking the snapshots. All we need to do is set its Status Reason field to Scheduled, save the record and the process kicks off. The Asynchronous Batch Process Pattern solution will run every day (unless residing on a shut down virtual machine, like in my example image below), triggering the Take Goal Snapshot workflow, which in turn will create a daily snapshot of the actual and target number of active cases in the system. You can naturally visualize the history data with a chart, too. If you have different goal owners or several different goals to take snapshots of, just create the necessary views to filter the data shown.

    To summarize, in this solution we use the Goal record as merely a “calculation machine” that produces the Actual Integer value we need. It also holds the data for the Target Integer, with the ability to update this figure if the targets should ever change. The scheduling is managed by the Batch Process record. It takes care of initiating the Take Goal Snapshot process for the selected Goal on a daily basis, which results in the creation of the Snapshot records you see above. All we had to do was to create each record once and we can leave this solution running for as long as we need.

    I think this is quite a wonderful example of how you can mix’n match the different functionality of the Dynamics CRM platform to come up with a new feature that doesn’t exist in the product right out of the box, yet it can be implemented by using the platform components and supported extensions developed on top of it. Thanks again to both Richard and Yaniv in providing me with the building blocks for implementing the recurring goal solution.

  • Dynamics CRM update & version madness explained

    Things used to be simple back in 2005 when I started working with Microsoft Dynamics CRM (known as only Microsoft CRM back then). You pretty much knew that there would be a version update every 2-3 years. In between, there would be a number of hotfixes created to address software bugs, which were packaged as “Update Rollups”. CRM 3.0 received in total three such packages. CRM 4.0 things kicked up a notch as we started getting these Update Rollups (UR) based on a regular schedule, one update every 2 months (until they were put on hold after UR21). CRM 2011 adopted the same UR release schedule, but in addition to that, Microsoft announced that they would adopt a new agile release model.

    Exactly one year after the announcement we find ourselves in situation that may seem quite confusing to the casual observer. There are new releases in the horizon on a continuous basis and it’s easy to lose track of what exactly is meant by which update. Well, here’s my shot at explaining what’s going on.

    What’s the “R” in R8?

    R8 means Release 8. OK, so what are the previous seven versions then? They don’t refer to CRM 1.0, 1.2, 3.0, 4.0 or 2011 (there never was a 2.0, as some of you will remember). This R-based naming policy comes from the CRM Online product, which used to have its own release schedule with no UR’s and a slightly different code base from the on-premises product. The first R was presumably released when CRM Online was announced in April 2008. Things changed when Microsoft Dynamics CRM 2011 was released on January 15th, 2011, after which both the Online and on-premises version have pretty much gone hand in hand.

    The “Rx” naming signifies a new functionality release and should never be used to refer to Update Rollup versions. Don’t shorten UR8 to R8, because the two are not the same (even though they are intertwined as we’ll later see). The Update Rollup version numbers always start from 1, so there’s been an Update Rollup 1 for both Dynamics CRM 2011, CRM 4.0 as well as CRM 3.0. Makes googling for information all the more merrier, eh? The Rx releases are a product of the cloud era and until we reach the next era beyond cloud apps, I don’t expect Microsoft to start the numbers from R1 all over again.

    What’s the Q2 2012 Service Update?

    Since it would have been confusing for on-prem customers to first release Microsoft Dynamics CRM 2011, then follow it up with a “Release 7” all of a sudden, Microsoft decided to come up with a different naming policy for these new, agile releases. Unfortunately, the naming policy they chose gave us monsters like “Microsoft Dynamics CRM 2011 Q4 2011 Service Update”. Wow, how catchy, and only 50 characters long! As a result of this, what was originally supposed to be just internal jargon became the preferred option for human communication and we learned to know the update as R7. 50 vs. 2 chars, which one would you expect to fly in the age of Twitter? ‘Nuff said.

    Most of you must surely be already familiar with the contents of R8, the next release, and if you’re not, here’s a link to the Release Preview Guide. The real catch is in how the promised new features will actually be delivered. The correct answers to this question are:

    • In multiple Update Rollup versions
    • As solution files
    • Through Microsoft hosted, subscription based services or 3rd party licensing
    • In other Microsoft products

    A, B, C, D – tick ’em all. This is the reason why there will not be any single place where you can “download R8”.

    What will the Update Rollup 9 contain?

    The official release announcement of Q2 2012 Service Update will most likely coincide with Update Rollup 9. However, if you study the contents of the Guide, you’ll find features that have already been released before UR9. Rapid View Forms were introduced in March as part of UR7 and re-labelled as Read-Optimized Forms. The same is true for SQL Server 2012 compatibility.

    As we know from the previous R7 release, Activity Feeds are delivered as a solution package that you will need to download from the Dynamics Marketplace and configure manually. The Activity Feeds solution is not a part of the “core” Dynamics CRM product. However, there are parts of it that have been built into the platform, which is why at least Update Rollup 5 is required in order to install the solution. Similarly, you will need to get an updated version of the Activity Feeds solution after installing Update Rollup 9, otherwise you won’t see the new features.

    A key deliverable of Update Rollup 9 will be the cross-browser compatibility that makes Dynamics CRM available on Chrome, Firefox and Safari. Since this is such a significant change to the platform, Microsoft has been kind enough to grant access to the R8 beta release for anyone who’s willing to follow these steps. Please note that the beta bits available for download cannot be upgraded to the final release of R8, so use them in a test environment only.

    Extended browser support is completely separate from the mobile device support promised in R8. While you will be able to run CRM on an iPad Safari browser, the mobile UI demoed by Microsoft in numerous occasions is only available as 1) a subscription service from Microsoft, if you’re running Online or IFD, or 2) a perpetual license to be purchased from CWR Mobility if you intend to host the required service on your own server. Trying to access your Dynamics CRM environment after UR9 installation with an iPhone will most likely just give you the simplified Mobile Express user interface already familiar from the CRM 4.0 days.

    Oh, and do note that the Microsoft Dynamics CRM Mobile released for Windows Phone 7 back in Q4 2011 Service Update is a completely separate product, even though it carries exactly the same name as the new offering developed by CWR Mobility and later on re-labelled by Microsoft. Since CWR Mobility didn’t have a Windows Phone client, this mobile app will likely remain on a separate development roadmap from the CWR-based offering.

    What’s the role of SQL Server 2012 in all this?

    If you haven’t seen the cool drag & drop report designer or the animated bubble chart demo of Power View, take a look at this video:

    Wow, wouldn’t that look nice on a Dynamics CRM dashboard! Well, even though Power View is listed as one of the R8 features, there’s a couple things you should know:

    • It’s not available in the cloud. Sorry, CRM Online users. Maybe in R9 then?
    • CRM dashboards are a different data visualization technique that will remain “as is” for R8, not integrated with Power View.
    The pre-configured Power View templates promised in R8 will be delivered as a Dynamics Labs solution, probably as a download from the Dynamics Marketplace. The same goes for the PowerPivot models to be included. Note that if you want to publish these PowerPivots to your organization, you’ll need an on-premises SharePoint Server 2010 with Enterprise CAL’s to view their contents on a browser window in your intranet.

    In addition, if you plan to use SQL Server 2012 for hosting your Dynamics CRM database and Reporting Services, it’s good to know that you can’t achieve this configuration with the RTM bits for Dynamics CRM 2011. Update Rollup 6 has established a new baseline for CRM and you’ll need to download the server installation files from Microsoft Download Center, otherwise you’ll run into the following error while trying to install the Reporting Extensions:

    Unable to validate SQL Server Reporting Services Report Server installation. Please check that it is correctly installed on the local machine.

    What time is Metro?

    Putting things into perspective, Dynamics CRM is a small fish in the tank compared to the big whale that is Windows 8. Since R8 will be out well before Windows 8, there isn’t yet a 100% support provided for the Internet Explorer 10 browser provided with it. Hopefully the remaining issues will be addressed by upcoming UR’s as Windows 8 is nevertheless just around the corner. Presumably we’ll see a proper Metro app for Dynamics CRM once R9 is released later this year. After all, the Windows RT tablets will not be able to run Outlook and we’ll need some solution for activity tracking to and from CRM.

    When it comes to Windows Server 8, official support has not been announced. However, that doesn’t mean you couldn’t install Dynamics CRM 2011 Server on a Windows 8. Daniel Cai has done just that and offers a tutorial for anyone wanting to test R8 on the very latest Microsoft products available.