If you’re using Dynamics CRM Online without direct access to the underlying SQL Server database, there may have been a few occasions when you’ve wished for more flexible options for reporting and customer data analytics than what is possible via configuring CRM charts or developing Fetch XML based reports in Visual Studio. Late last year Microsoft enabled support for accessing the secured OData feeds from CRM Online via the Excel Power Query tool, which opened up some interesting options for building modern BI solutions on top of the CRM data up in the Microsoft cloud.

For a non-developer who hasn’t leveraged OData before it might come as a bit of a surprise that not all of the business data is necessarily readily available via the feeds when examining a particular CRM entity. One crucial thing that’s missing is the option set values. More specifically, it’s the label values that are not accessible via the entity tables retrieved via the OData feed, as all we have access to are the numerical values representing the labels (1, 2, 3, 4… 10001), but not the human readable versions.
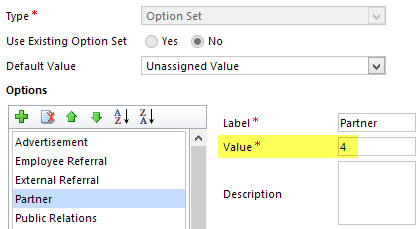
From a reporting perspective, it’s very likely that any chart or table that you wish to build is going to leverage one or more option set fields. Formerly known as picklists, these are basically the dropdown fields on CRM entity forms that allow the user to select one value from a list of predefined values. Much more convenient for reporting purposes than free text fields, as I’m sure you’d agree.
So, what are our options then? We could of course manually create new tables into the Excel workbook that store the mapping of ID values and labels, but that just doesn’t sound like a fun exercise at all. More importantly, that would only give us a static list of option set values that couldn’t adapt to the changes in CRM customizations. Nope, not a good approach from report maintenance perspective, so let’s not go there.
As a bit more efficient workaround we could be adventurous and import a copy of the CRM solution file containing the entity customizations as an XML data source into Power Query and then pick out the necessary mappings from there. Due to the power of Power Query, this would actually technically work, and we could even set it to reference a file location from where the latest customizations would dynamically be imported upon workbook refresh. Still, that would leave us the burden of setting up an automated export system that would produce the customizations.xml file to reflect the latest changes.
After a bit of poking around in the OData feed data source, it turns out the optionset labels are actually included there. The tricky part is that they’re not simply a [Record] link that you can drill into and expose the values from your existing entity data set. Nope, they reside in a specific table of their own, called PicklistMappingSet. In this tutorial I’ll show you how to retrieve the data for a “Leads by Source” chart created with Power View, taken from an OData feed data source pointing to Dynamics CRM Online, using Power Query to pull the data into a data model built with Power Pivot.
1. The Data Source: Power Query
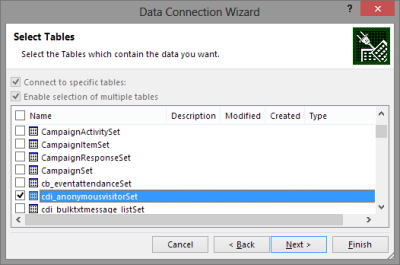
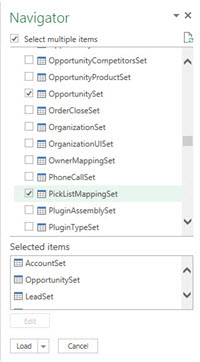 To follow the steps you should have the latest Power Query version installed in your Excel client. I’ve already covered how to access CRM OData feeds from Power Query in a previous article, so please refer to that one if you haven’t done the exercise before. After connecting to the OData feed URL we should select the tables that we want to work with from the data source navigator pane. By minimum you should grab the LeadSet and PicklistMappingSet to build the chart.
The problem with CRM and OData is that by default the feed will pull down each and every record in the table. The query performance is less than stellar with CRM Online and if you have a high number of leads (status doesn’t matter, also the closed ones will get downloaded), you might be waiting for a while before the query is completed. If you want to move on a bit faster then check out this great tip by Andre Margono on how to set up a query filter for the Dynamics CRM OData query (for example, only active leads).
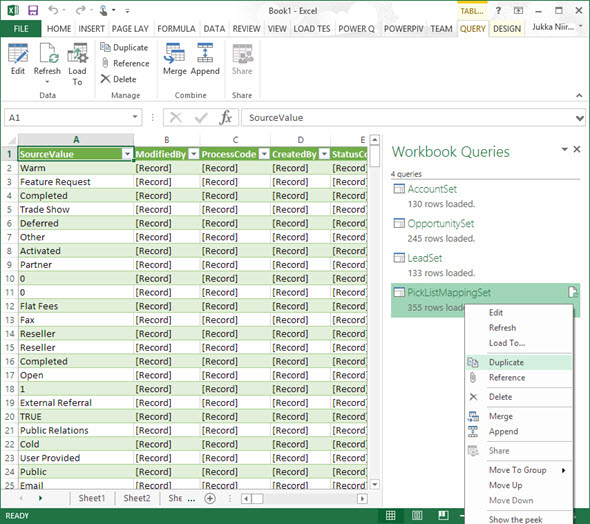
The real beauty of Power Query is in the query steps you can use for manipulating the workbook queries. Before we go there, though, let’s create a duplicate of the PicklistMappingSet query. This will make it easier for us to map the values into our actual leads table later on, as well as preserve the original option set value table available for further queries.
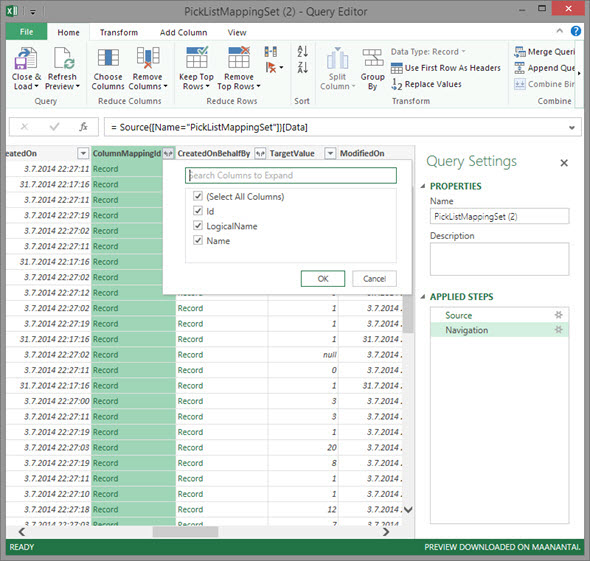
Open up the new duplicate query you’ve added into the edit mode by double clicking on it, which launches the Power Query query editor (yes, query is the word of the day). The first step we’re going to add for the query involves expanding a column that only shows a green “Record” value by drilling into it from the small icon next to the column label. Do this to the ColumnMappingId column and just load up all the columns found from behind it.
You’ll see the Record column transformed into three new columns as a result of drilling down into the data. The column we’re interested in is ColumnMappingId.Name, which has the names for all option set fields in our source CRM system. For this example we want to see the LeadSource field, so add a new filter for this value, just as you would in a normal Excel data table.
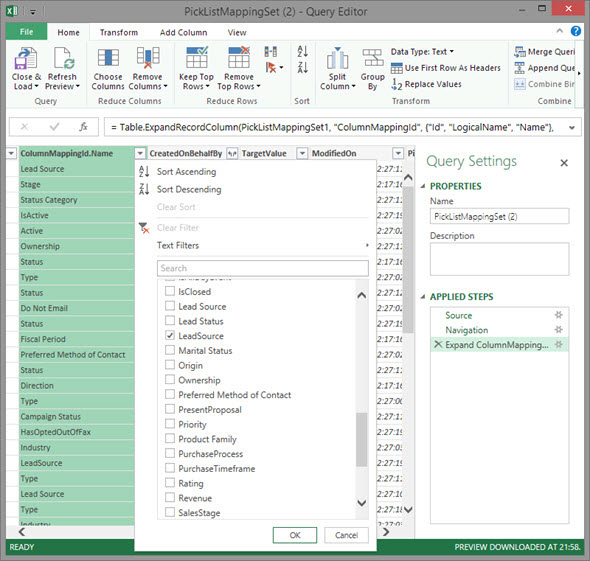
By now you might have noticed that the Applied Steps box in the Query Settings pane is collecting all of the actions that we’re performing on the query and storing them as steps. If you make an error in your selection, just click the delete symbol next to the steps to get rid of it. (more…)
![Dynamics CRM OData Feeds and Power Query: What’s the [Record]?](https://jukkaniiranen.jukkan.com/wp-content/uploads/sites/6/2014/02/pexels-photo-177598.jpeg)


 There are some great new features available in Excel 2013 that can take your Dynamics CRM data visualization onto a whole new level without the need to invest in new server infrastructure or build traditional OLAP cubes on your SQL Server. With the recent announcement of the