Category: Power Apps

  • CDS FAQ for the Power Apps Makers

    CDS FAQ for the Power Apps Makers

    Microsoft is commited to making Common Data Service the flagship data source for Power Apps scenarios, as well as delivering advanced enterprise application lifecycle management (ALM) features via CDS. What can make the role of CDS somewhat difficult to approach for app makers is the fact that it hasn’t originally been built for Power Apps, like CDS “v1.0” was. The current CDS “v2.0” is based on XRM, the business appliciation platform that was born alongside the Microsoft Dynamics CRM product.

    I’ve been working with this plaform technology for close to 15 years now, whereas the world of Power Apps Canvas apps (and Power Automate) is a much more recent acquaintance of mine. To put my experience into good use and to also learn to see things from outside the XRM walls, I decided to share answers to a few questions that I’ve heard from #PowerAddicts that are exploring the CDS world.

    Q1: Why should I use CDS as my data source instead of SharePoint or SQL Server?

    Because it is not just a data source. Yes, in Power Apps Canvas apps you do connect to it just like any other data source in the app Studio, but this is misleading. CDS is the complete platform that can orchestrate how your app works when it comes to business logic, security model, integration, administration, governance and many more areas. Compared to raw SQL Azure, the SQL relational data is actually just one of the storage types that CDS leverages behind the scenes. Ultimately it’s a bundle of the latest Microsoft cloud technology for compute, storage and eventing/extensibility – offered as a single service that you don’t have to configure nor manage. You consume it either via built-in integrations to Power Platform, Dynamics 365 and Office 365, or alternatively via an API that is automatically generated to match your customized schema.

    The topic of “why CDS” would easily warrant a whole series of extensive blog posts on its own, which I may well do later on, but not inside an FAQ like this. For now, I recommend that you watch this Ignite 2019 session from Ryan Jones to understand the big picture of Common Data Service:

    Q2: What’s the difference between the 2 connectors for Common Data Service?

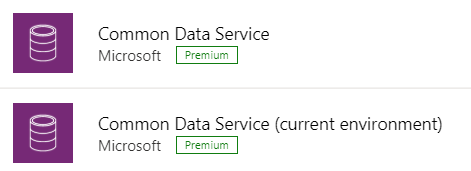
    The current environment connector is a native connection. This is the misleading part. It’s not a real Connector at all, rather every Power App knows how to talk with the environment that hosts it, which essentially is the current CDS environment. This leads to numerous benefits in performance and available features, as the technical implementation behind the scenes is quite different. I haven’t come across a Power Apps specific comparison yet, but MVP Sara Lagerquist has done a thorough analysis of the two CDS Connectors in the Power Automate context.

    Q3: Is there any reason to use the non-current environment CDS connector then?

    Yes, if you want to connect to a CDS environment that’s not the one which is hosting your app configuration. Meaning, if there is busness data out there in another CDS database and you need to reference it in addition to the “native” data in your app’s environment, the old CDS Connector might well do the trick. However, this is an area to keep a close eye on for the detailed functionality over time, as MS is very much wanting everyone to “go current” and some issues might arise from remaining on the old Connector.

    Q4: Why should I use solutions for building my app functionality in CDS?

    Even if you’re working in just a single environment, building a simple app directly in production (which is what a citizen developer often might do), solutions offer you the logical grouping of elements that are part of your project. In fact, at some point MS experimented with changing the Maker UI to read “projects” instead of “solutions”, but luckily that change was reverted back. It can stil be a helpful concept to illustrate the purpose of solutions for those who aren’t familiar with CDS. The act of building an app needs to manifest itself somehow within the environment, so always start by creating at least one solution for your project. (Real life projects may well have more than one solution, thouh.)

    What solutions really are designed for is shipping the elements of applications into other environments, in a process that is easy to manage and possible to automate. Microsoft is aiming to make solutions the packaging story across all of Power Platform, which means it’s not an optional concept. It’s how things are built within this business application platform.

    Q5: I’ve read about this thing called “managed solutions”. When should I use them?

    There’s the saying “if you have to ask how much it costs, you can’t afford it”. In my opinion, this fits perfectly with managed solutions, too. Unless you are really, really well educated with how the solution system in CDS works (meaning you’ll probably have an XRM developer background), don’t touch managed solutions – yet.

    When delivering complex enterprise CRM systems with multiple full time developers writing custom code and leveraging Azure DevOps for automated CI/CD pipelines, managed solutions are the way to go. Similarly if you’re building an ISV app for many different customer organizations and hope to publish it on AppSource, you simply have to go managed. We’ll most likely see Microsoft making the managed solution concept more approachable for other audiences in the future, too, so please do educate yourself on their possibilities and get ready for building more complex apps at scale.

    Q6: Couldn’t I use managed solutions to lock down my app components from other makers?

    Yes, but not in the environment you’re probably working in right now. When building apps, you’re always working in unmanaged mode. It’s only when you export your solution from the current environment that you get a choice to make the solution package either managed or unmanaged. Shipping configurations from dev to test & prod is what this mechanism is for. If you only have a single environment for the app makers where the small departmental or personal productivity apps are built by citizen developers, none of this stuff applies to you.

    No. Don’t ever re-import the managed solution back to the environment where it came from. That’s locking yourself in and throwing away the key. It’s not what you want.

    Q7: Is there any other way to restrict specific entities to be only customizable by certain app makers if we’re working in a shared CDS environment?

    No. The metadata of CDS doesn’t have such security mechanism that would allow you to say that “Group A owns the account and contact entities, Group B is responsible for the project, task and resource allocation custom entities”. Within a single environment, there can be only one god, and that is the System Administrator. System Customizer also comes close, as both have the rights to create and delete new entities on a whim.

    Records stored within an entity always have an owner. An account is owned by User X, which can be used for determining what other users can do with it. The actual account entity i.e. the table that holds the records doesn’t have this type of ownership construct, as it applies only to data and not metadata. If you need more granluar control over metadata, then the answer is to set up different environments for the different groups.

    Q8: How can I see what privleges a particular user has been given in CDS?

    Security roles are a central construct in CDS, as everything you attempt to do in the database is verified against two key parameters before execution:

    1. Do you have rights for the specific action against the entity where the data is stored?
    2. Who is the owner of specific the record that you are trying to perform the action on and what’s the relationship to the calling user?

    The UI for security roles dates back to MS CRM v.X days and is scary both due to the legacy experience as well as the variety of options found in even a blank CDS org. Nevertheless, it is logical and will tell you what you need if you know what you’re searching for. Let’s compare 3 standard roles of Common Data Service User, Environment Maker and System Customizer and their privileges on the Customization tab:

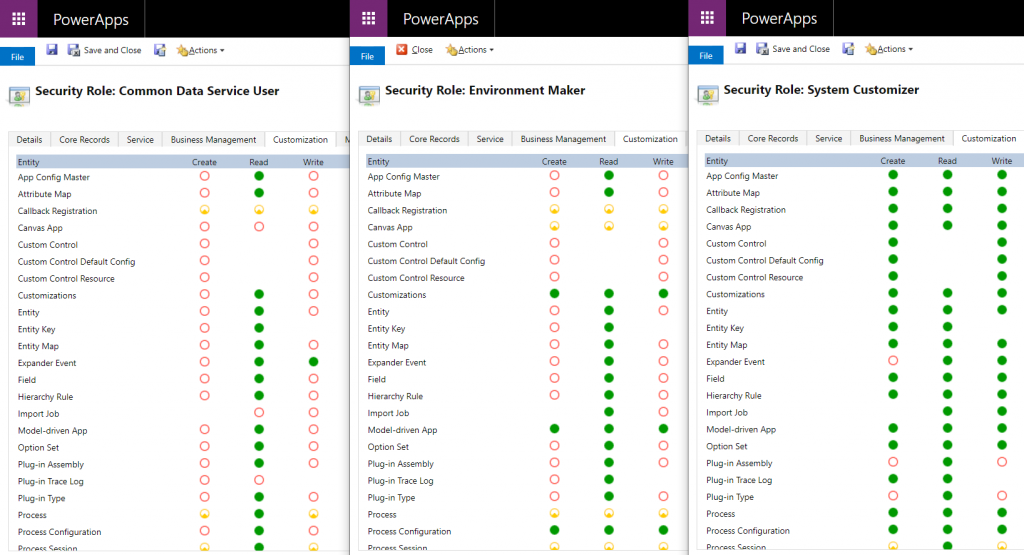
    The CDS User has mostly just read access to the metdata, like Entity, Field, Option Set and so on. An Environment Maker is allowed to create new items like Canvas Apps & Model-driven Apps – like a Maker should. To actually create new Entities and Fields, you’ll need to be a System Customizer or Administrator.

    This is where the platform aspect of CDS (and its predecessor XRM) comes into play, though. You can create your own security roles, preferably via copying an existing system role that’s close enough. So, you could create a new “Environment Super Maker” that would have the right to create new fields, but not new entities, nor delete any fields. So, security roles are not only the gatekeeper to business data but also metadata.

    Q9: Looks like these security roles are environment specific. Do the IT admins really to go and manage the security settings via this MS CRM Power Apps UI?

    Not anymore! Last year Microsoft finally brought Azure AD integration into the system administration features of Dynamics 365 and thus CDS. You can now leverage the Group Teams to assign CDS security roles to an Azure Active Directory group (security or Office group) and the users will inherit the privileges of that role when added to the group.

    While Azure AD groups definitely streamline the administration process, please keep in mind that there’s more to CDS security model than just the security role assignment. Business Unit structures, Field Level Security, Hierarchical Security are some aspects that may require admin actions directly within the environment to get them set up properly.

    Q10: Why do all these user accounts from across the organization appear in the CDS environment meant for department X only? Can they all access it?

    You probably didn’t assign a security group to the CDS environment right at the start when it was created. Therefore every licensed user account in your tenant was copied over to the environment. If you assigned a security group to the environment after its creation, then those user accounts will be automatically disabled. They will forever remain in the database tables as inactive users, though, since user record deletion is not something XRM nor CDS has ever supported.

    Just because a user exists inside the CDS environment’t systemuser table doesn’t mean they can do anything in that environment. Not even if they haven’t yet been disabled. Everyone needs a security role to have a chance to read both the metadata and the business data from CDS, so the user record is just a prerequisite to opening the door to the environment but it doesn’t provide the key to the lock.

  • Using CSS color names for SVG icons in Power Apps Canvas app

    Using CSS color names for SVG icons in Power Apps Canvas app

    In my previous post we took the contents of an open source SVG icon library from GitHub and imported that into a Canvas app as a static Excel table, with the help of Power Query. This time we’ll explore how working with the icon colors can be expanded compared to the standard functionality offered by Power Apps Maker Studio.

    Standard color picker

    If we are inserting any of the out-of-the-box icons into our app screen, Power Apps offers a color picker that works the same as when defining the color of a text font. The first option is the standard palette with theme colors and, um, “standard” colors:

    Then there’s the “any color you could imagine” option where you can either pick the color from the sliders, type in the hex code or use the RGBA code:

    The third option is a bit more hidden, so you’ll only find it when using the formula bar. You see, Power Apps actually supports also the CSS color names, so you could type in the value as “DarkBlue” and get exactly that for your icons:

    The Power Apps documentation contains a list of built-in colors supported and their CSS color names. Now, the idea of having the standard CSS palette with its easy to understand color names instead of cryptic Hex codes or RGB values sounds attractive for a low-code citizen developer like me. However, there isn’t really any convenient way to browse through these colors and see the results in the Canvas app UI. Unless we build one for ourselves!

    Custom color picker

    Just like with the SVG icon definitions, we can use the option for importing static reference data from an Excel table to enhance the app maker experience. What we’d need first is a suitable list of the CSS color names, alongside their attributes. Rather than searching for the perfect table online, I just grabbed the data from this CSS Color Codes page on RapidTables. What I especially liked about this page was that the colors were grouped based on the color “family”, meaning different tables for red colors, orange colors, yellow colors and so on. That’s the way I’d really want the colors to be organized, rather than the alphabetic list over on docs.microsoft.com. With some copy & paste, I ended up with an Excel table like this:

    You can grab my .xlsx file here. Let’s import that into our app via the Excel static data connector, as a table called ColorTable:

    We can now add a gallery control into our app and use the columns from our ColorTable as values for the fields in this palette browsing gallery:

    “Wait, how did that visual color indicator get there?” Oh, that’s easy! We just added a rectangle into the gallery and used the ColorValue function to reference the Color Name column from the table that we imported from Excel:

    What I didn’t add there into our gallery yet was the Color Group information. That’s because I want to have this as a separate parameter that I can use to narrow down the list of CSS color names presented in the list. Let’s name the first gallery to “galColors” and create a second horizontal gallery called “galColorGroup”, which will contain a list of all the group names included in our Excel table.

    How do we get just a single “Green” and not all of the 19 different instances of that same text string in the source table’s “Color Group” column? We use the Distinct function and tell it we’re looking for data in the ColorTable data source and the distinct values should come from this particular column:

    The Distinct function returns a table with the single column “Result” as seen from the formula bar preview. We’ll add label into our gallery and populate the text value with this Result directly. To set the fill of the label’s rectangle area we’ll use the same ColorValue function as in our first gallery and point that to the Result column. Now we’ve got ourselves a galColorGroup gallery with 11 distinct values visualized:

    Let’s use the selected Color Group now as a filter to list only that group’s CSS color names in the other gallery. For galColor the Items parameter should read:

    Filter(ColorTable, 'Color Group' = galColorGroup.Selected.Result)

    While we’re at it, let’s also add labels on top of each gallery to state the currently selected value. For galColorGroup, we’ll want both the group’s name as well as the number of items returned after the Filter has been applied in the galColor gallery. We’ll concatenate the selected item’s name plus the CountRows result from the galColor gallery into a single text string like this:

    "Color group: " & galColorGroup.Selected.Result & " (" & CountRows(galColor.AllItems) & ")"

    For the second label, the selected color’s CSS name is enough for us:

    "Color: " & galColor.Selected.'Color Name'

    Now we can click on a value in the Color Group gallery like “Gray” and be presented with a filtered list of the 10 available shades of grey:

    Using selected CSS color name as SVG icon color

    The last bit is connecting the color with the icon library we imported in my earlier blog post. As a quick recap, the SVG icon shapes can be defined in the image property of a Power Apps image control by constructing the XML in the following way:

    "data:image/svg+xml;utf8, " & EncodeUrl(
        "<svg version='1.1' id='Layer_1' xmlns='http://www.w3.org/2000/svg' xmlns:xlink='http://www.w3.org/1999/xlink' x='0px' y='0px'
    	 viewBox='0 0 24 24' style='enable-background:new 0 0 24 24;' xml:space='preserve'>
    <path fill='" & "Black" & "' d='" & ThisItem.path & "'/>
    </svg>"
    )

    You’ll notice that while we pulled the path’s attribute “d” from the dynamic value of ThisItem.path, we had left the path’s fill attribute hardocded as “Black”. Changing this to a dynamic value will allow us to render the SVG icons in any color we’ve chosen elsewhere. To make this work in conjunction with the CSS color name picker functionality we’ve built into our app, let’s add a button above galColor and use the OnSelect event to set a variable called SelectedColor to be the CSS color name of our choice:

    Now we’ll just change the SVG icon’s XML definition to reference this variable’s value as the fill color:

    This allows us to combine the earlier SVG icon gallery with our CSS color name gallery and make the color choice reflected visually immediately on all the visible icons:

    The visual part is what I love about this example of working with icons and colors in Power Apps. It’s a great exercise for learning how to work with data sources from the outside world and seeing how the Power Apps Canvas app UI changes as you modify your formulas and shape your galleries. Being able to inject dynamic values into XML that the app then renders in real time is a demonstration of how the low-code app development tools available in Power Platform can serve to unlock your creative powers, even if you have no skills on actual “pro code” development. Understanding how different color values can be passed on from one place to another and transformed via functions along the way also teaches you a lot more than using the standard color picker to set the static fill value of a single control.

    For me personally, it’s also an exploration of how to leverage configuration data when building Canvas apps. Coming from the Model-driven app customization world of XRM, my mind is still somewhat fixed on thinking via metadata, even though I’m trying to make the leap into UX first Canvas apps building (see this presentation for some of my tips on surviving that leap from Dynamics 365 to Power Apps). The possibility of importing static tables from Excel that are then preserved within the app is an interesting option to try and make the app building process a bit more structured than what the maker tools in Power Apps offer. I’m going to continue my experimentation and try to turn this example app into something that could offer reusable logic and configuration data when generating brand new apps.

  • Using SVG icons in Power Apps Canvas apps

    Using SVG icons in Power Apps Canvas apps

    When creating business applications on Microsoft Power Platform, a major difference between the traditional “CRM style” Model-driven apps and the modern “mobile first” Canvas apps is the possibility of visualizing data and available features in the app. Yes, having well-structured data to begin with is of course a fundamental requirement of being able to construct a meaningful business app. The freedom of pixel perfect visuals that Power Apps can deliver in the Canvas style apps is, however, an important factor when it comes to the perceived value that the end users can get from accessing the app.

    If you’re willing to spend time in generating static images for all the different areas of your app UI and, more importantly, to reflect the state of your app in relation to the data that the user is viewing, then the sky’s the limit for what you could achieve with Power Apps. Now, considering that these low-code/no-code tools aren’t exactly targeted for professional app development teams that would have designers equipped with the tools & skills to create amazing graphics on demand, we often need to explore more frugal ways to make the app visuals serve their purpose. For those of us with next to zero skills in graphic design, sources of free / open source digital illustrations like IconFinder are like a gift from above. There are also a number of awesome icon libraries available on GitHub. Here’s an example of Simple Icons:

    Static graphics like PNG files can already do wonders to your Power App UI, but wouldn’t it be nice if you could also leverage the more scalable and adaptable SVG’s (Scalable Vector Graphics)? Especially for monochrome line drawings like the ones you’ll see a lot in today’s flat app UI, an SVG with transparent background and also a configurable color would be highly useful. Unfortunately, Power Apps today doesn’t support SVG file manipulation when imported as images. There’s a built-in set of icons that come with the Maker studio, which most probably are vector graphics, but you cannot add your own icons into that list. What this means is that if you import an SVG image into your app, there’s not going to be any more parameters available for you to adjust than if you had brought in a JPEG. Doh!

    A Canvas app that I’m currently building requires a large number of icons that should be dynamically changed based on a variable. For the purpose of mapping the suitable icon with a specific value and testing the UI, I wanted to bring in a whole library of icons and play around with it in Power Apps Maker Studio. In order to have better control over the icon appearance, I wanted to be able to modify the actual XML definition that makes up the SVG icon. Here are the steps how I managed to get the data inside the app and also how to render the SVG icons from the XML that I dynamically modify with formulas.

    Combining your SVG files into an Excel table

    Excel is a data source in Power Apps that allows you to import a static table of data into the app and store it there for all the app users to consume, without having to work with connections to external data sources. This type of resource file was quite convenient for my purposes, so the first thing I had to figure out was how to get a folder full of SVG files imported into an Excel table where each icon’s definition is represented on one row. In the above example of Simple Icon library, this would be the contents of the folder “\simple-icons-develop\icons”.

    Power Query in Excel has the “From Folder” option available when using “Get Data / From File”, which brings in not just a single file but rather all the files inside a specific folder. Great, that’s what I needed! Oh, but the source files I have are SVG which Excel doesn’t understand. No problem, let’s just change the file type to XML by renaming the files with by running this in the Command Prompt after navigating to that folder:

    ren *.svg *.xml

    This is what we should now have:

    Now we’re ready to consume the folder contents in Excel. Using “From Folder” and selecting “Transform Data” in the import prompt, we see a view like this:

    A good start, but we need to do some transformations to this data. First, in the Content column, click on the two downward arrows for “Combine Files” and see the results:

    Awesome, now we’re actually inside the XML file structure! What we’re really after is the <path> element in SVG , which is the ultimate drawing that creates the lines, curves and shapes. We don’t have to understand anything about its syntax (well, at least I don’t) but we need this data to get Power Apps to render the SVG shape inside an image control. Since it’s currently a table in the Power Query Editor, we click on the two parting arrows to expand its contents, which consists of a single attribute called “d”.

    We’ve now got everything we need, so the last steps are in removing unnecessary columns and renaming the existing ones. The first three ones are what we want to save into our Excel table, so let’s simplify the column names to “name”, “title” and “path”, then click Close & Load. You should have a beautiful Excel file with as many rows as you had files in the source folder. Before saving and closing the .xlsx, give the table a sensible name that you want to have showing up as the data source name in Power Apps.

    Visualizing SVG data from Excel inside Power Apps

    How does one actually turn the XML definition data into a visible image in Power Apps? There’s a great blog post from Laura GB titled PowerApps – SVG Introduction, which gives us all the details needed to make the Image control render our SVG data. To see how it works in practice, let’s first bring in our Simple Icons Excel table into Power Apps as a data source:

    Next we can add a horizontal gallery onto our screen an choose to use the imported table “icons” as our data source:

    Our table has the three columns we left in there when working with Power Query. From the default mapping we can see that the gallery item’s Subtitle1 label has “ThisItem.path” as the Text value. This is the data we’ll want to use in the image control of the gallery item, but first we’ll need to wrap it into something that gives Power Apps the context around it needed to render the SVG image, since we only imported the one attribute and not the complete XML. However, since this XML part will be exactly the same for any icons that we want to display from this Excel table, it can consist of static text, inside which we’ll inject a few dynamic values with the Power Apps formulas. Adapted from Laura’s post, this is how the Image property of the Image control inside the Gallery item should look like:

    "data:image/svg+xml;utf8, " & EncodeUrl(
        "<svg version='1.1' id='Layer_1' xmlns='http://www.w3.org/2000/svg' xmlns:xlink='http://www.w3.org/1999/xlink' x='0px' y='0px'
    	 viewBox='0 0 24 24' style='enable-background:new 0 0 24 24;' xml:space='preserve'>
    <path fill='" & "Black" & "' d='" & ThisItem.path & "'/>
    </svg>"
    )

    The important part is how we construct the “d” attribute from ThisItem.path on line 4, as that will be the only dynamic value in our SVG for now. Here’s what the result will look like:

    It works! We can now design a gallery that will allow us to conveniently browser through the complete collection of 1007 icons in the library, by having a live “thumbnail” of the icon in a smaller 100*100 image control. To then view the selected icon in a larger format, let’s add a new image control outside the gallery and set it’s Image property to reference the Image of the selected item from Gallery1. Since these are vector graphics, there should be no loss of quality, no matter how large we set the image size to be:

    If we now want to use these imported SVG icons from anywhere else in our app, we can just do a LookUp to the data source with the icon name and return its path, like this:

    LookUp(icons, name = "microsoftexcel", path)

    Using this when wrapped within the same formula we used earlier for showing the gallery’s selected item’s path will now give us a rendering of the SVG icon that matches our LookUp function:

    “Hmm, wont this kind of library of a thousand icons make our app size huge?” Not really. Since we are only storing the shapes instead of the pixels, the payload will actually be very compact for each icon. In this example with the Simple Icons library, here’s how much storage the different parts consumed:

    • Icons folder from the GitHub project: 1.5 MB
    • Excel file with icon XML imported via Power Query: 661 KB
    • .msapp file of the example app with static Excel data imported: 592 KB

    By taking just what we need (the shape information) and leaving out the static XML file’s overhead we’ve actually managed to shrink the 1007 icons into a much smaller space with our Power App. The other benefit is that further adjustment like icon color can now be set in our own formulas. In a follow-up post I’ll continue adding features into this icon library browser app to make use of exactly this capability.